Table Component User Experience Testing
UX Designer | Texas Department of Transportation
Background and Objective
We audit components for potential improvements and the table component was next on our list. Additionally, the Web Services team wanted “to give authors a checkbox that would let them display the table in rows of 10 with the option to show all.” So we set out to:
understand whether minimum level of usability has been met.
understand whether participants understand basic functionality of tables.
gather any other feedback on tables participants have
Research Questions
Do users understand the improved functionality and features of the proposed table component?
Pagination
‘Show All’ Button
Sorting (descending vs ascending)
Are there any difficulties or frustrations with table functionality?
Any other feedback on functionality?
Hypothesis
Participants will understand and effectively use the proposed table component's new features, including pagination, the 'Show All' button, and sorting functionality (ascending/descending). Participants prefer a truncated table over long lists and rows of information.
Methodology
Methodology: Light moderated qualitative usability testing
Format: Remote
Duration: 15-20 minutes
My role
As the UX Manager, I played a leadership role as well as project management, UX & UI Design, and research strategy:
Project management: Set expectations, timeline, etc. for Web Services team.
UX & UI Design: I designed the updated component and built the interactive prototype before handing it over to our Senior UX/UI Designer to test.
Research strategy: After reviewing timeline and desired project effort, I decided on a lightweight qualitative prototype set was the best approach.
UX development review: As part of our maturing UX practice, I helped establish and now lead a critical phase in the development workflow: UX and UI review of components before production release.

Previous Table

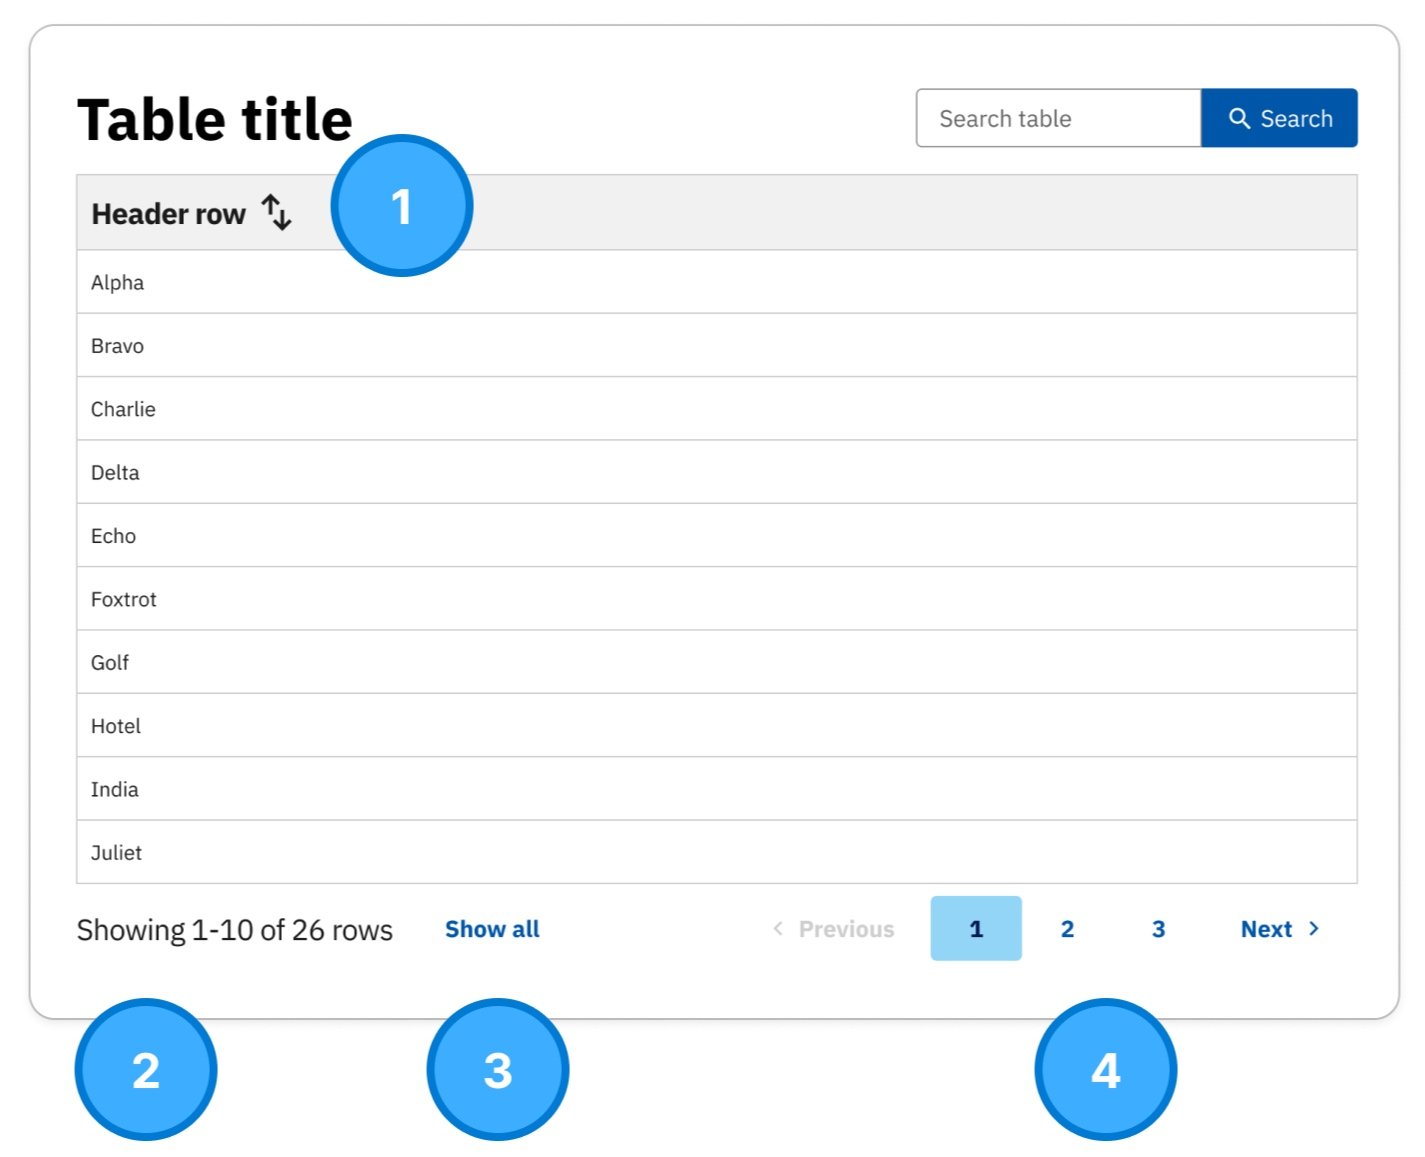
Updated Table
Key Improvements
The table previous sorting icon was too small and didn’t meet accessibility guidelines. The new icon were larger and improved click targets for mobile users.
Larger tables are limited to 10 rows, and users now have information indicated the number of total rows and their location within the overall list.
A tertiary button was provided allowing users to expand the table to show the entire table with one click.
Pagination including previous and next buttons were added for improve navigation.
UX Development Review
This step ensures that every piece of interface work adheres to our standards in usability, accessibility, and visual design.
I worked with front-end developers to implement a structured review process that occurs after development is complete but before components are merged to production. Key aspects of my involvement included:
Defining the checklist criteria based on our design system, WCAG accessibility guidelines, and responsive behavior
Creating a shared Figma → Code QA workflow for tracking approvals
Leading visual and interaction walkthroughs, checking for alignment with high-fidelity mockups.
Testing responsiveness and accessibility, including keyboard navigation, screen reader labels, and color contrast.
Providing detailed feedback to ensure consistency and functionality requirements are met.
Impact
This review process has significantly reduced rework post deployment and improved overall UI consistency. It has also fostered better collaboration between design and development, encouraging shared ownership of quality. Developers are now more familiar with design system expectations, and UX designers are better looped into the build process.


Testing
We tested the new table with a small group (less than 10 users) to see if the new table approach support our hypothesis. Some tasks participants were given were:
Find a the last row in the table.
Use an alternative method to accomplish the same task.
Find a row staring with a specific letter.
Use an alternative method to find a row starting with the specific letter.
View the entire table.
Additional users feedback
The table design is boring and could be improved.
At least 3 participants expressed some level of discomfort using the content management system.
Some participants wanted the ability to group rows more intuitively through tabs or other options.
Analysis & Results
Most participants opted for “show all” when navigating and expanding the table.
50% of participants used the "sort rows functionality” to find specific rows.
One participant used search to find a specific row.
All participants used the “show all” to view the entire table.
Some participants showed hesitation using the new sorting icons.
Recommendations
Expand testing pool and experiment with different sorting indicators/icons.
Consider alternate row shading.
Improve table authoring capabilities.
Experiment with mobile tables specifically card approach to rows.